We all know that different countries carry different investment risks- but here’s a handy graphic that gives us a snapshot view of each country’s risk level.
We see SA at 8.9 being one of the lowest risk countries in Africa, however by developed market standards, it’s 71% more risky than USA, Germany, Australia, and others at 5.2. So, theoretically one can take the higher risk offered by many emerging market countries and be compensated with better returns. The problem is, when investing in those countries, one is exposed to their currencies which can be quite volatile too.
To find some balance between risk and capital security, it’s a really good strategy to invest in developed market large-cap global companies which are based in their respective AAA credit-rated countries. These large global companies generate their business from developed and emerging markets and tend to provide a more stable return due to their giant capacity and world-class management.
How Do Countries Around the World Compensate for Equity Risk?
From Advisor Channel
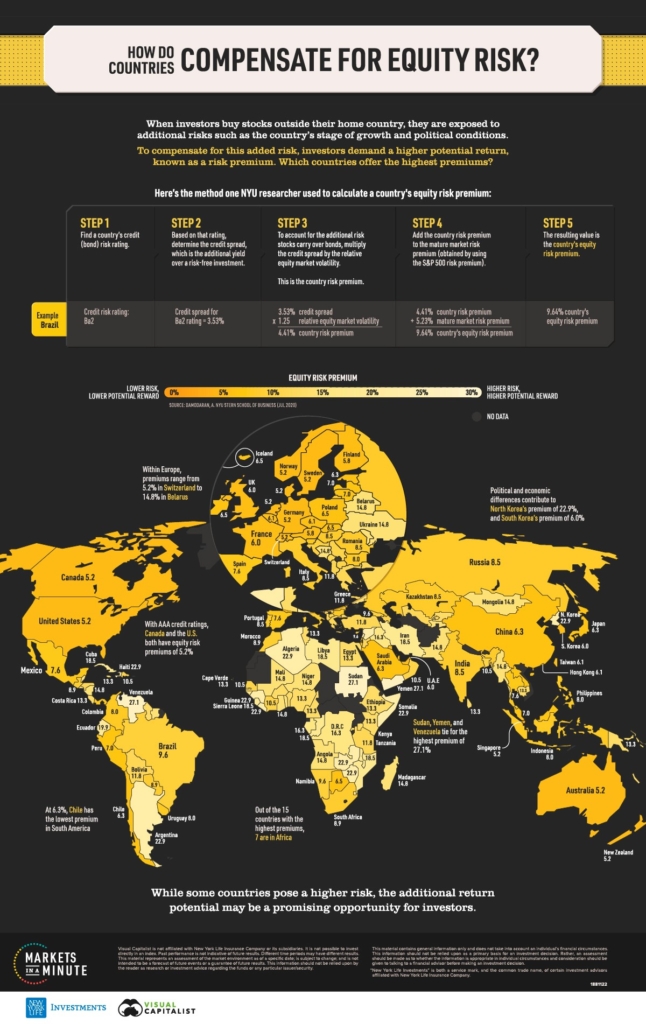
When investors purchase stocks internationally, they are exposed to additional risks. Companies may have higher volatility based on a country’s economic, political, and legal conditions. In exchange for taking on the additional risk, investors demand a higher return potential, known as an equity risk premium.
Equity Risk Premiums by Country
Below, we look at how equity risk premiums break down for 177 countries and regions, organized from highest to lowest.
Search:
| Country | Equity Risk Premium |
| Sudan | 27.14% |
| Venezuela | 27.14% |
| Yemen, Republic | 27.14% |
| Algeria | 22.86% |
| Argentina | 22.86% |
| Guinea | 22.86% |
| Haiti | 22.86% |
| Korea,D.P.R. | 22.86% |
| Lebanon | 22.86% |
| Liberia | 22.86% |
Venezuela, Sudan, and Yemen are tied for the highest equity risk premium. While Venezuela battles hyperinflation, Yemen is suffering from a humanitarian crisis and Sudan has high perceived corruption.
In the mid-range, emerging countries such as Brazil, South Africa, and India carry moderate risk. However, they may also provide investors with higher returns than can be expected in mature markets.
On the low end of the scale, countries such as the United States, Singapore, and Germany have AAA credit ratings and the lowest premium of 5.23%.
Applying Risk Premiums to Companies
How can investors determine the equity risk premiums for individual companies?
One method is to assume that all companies incorporated in a country have equal exposure to that country’s risk. However, this is a simplified approach and does not account for the fact that a company’s operations may extend into other markets.
Alternatively, investors can calculate a weighted-average premium based on the location of a company’s revenue or production. For example, a consumer products business may weigh exposure based on the location of their revenue. An oil and gas company, where true risk lies in their reserves rather than where they sell, may instead be weighted by production.
Here’s a hypothetical example for an oil & gas company that has reserves in the United States, Saudi Arabia, and Venezuela:
| Country | Production (in kboed)* | % of Total | Equity Risk Premium |
| U.S. | 60 | 20% | 5.23% |
| Saudi Arabia | 120 | 40% | 6.26% |
| Venezuela | 120 | 40% | 27.14% |
| Total | 300 | 100% | 14.41% |
The weighted-average equity risk premium is 14.41%.
Importantly, even countries headquartered in mature markets have international risks if they carry out operations in other countries.
Risk Vs. Potential Reward
Every country presents varying degrees of risk based on local conditions. As investors look to diversify internationally, it’s critical to consider two factors:
- The additional risk
- The potential additional return
Equity risk premiums serve as a guide that can help investors compare country risk, and the additional return potential they should expect for tolerating that risk.

In the News this Week:
- Annual headline consumer inflation edged up marginally to 3.2% in January from 3.1% in December, in line with the market’s expectations. The main contributors were the ‘food and non-alcoholic beverages’, ‘housing and utilities’ and ‘miscellaneous goods and services’ categories, which added a combined 2.5 percentage points to the headline figure. Most categories grew at a softer pace, with notable price increases in the ‘clothing and footwear’ and ‘restaurant and hotel’ categories, which largely captured the change in consumer behaviour and preferences following strict lockdown during last year. Food price inflation softened to October 2020 levels, although meat prices remained elevated. Fuel prices continued to recover.
- Over the month prices edged up by 0.3%, with the food, transport and miscellaneous goods and services categories contributing 0.1 percentage point each.
- Core inflation remained steady over the past three months at 3.3% y-o-y. Goods inflation increased to 2.7%, after remaining sticky at 2.6% during the previous three months, driven by semi-durable goods which quickened by 1.1% from 0.8% in December. Prices of durable goods softened to 3.3% (from 3.4%), while non-durable goods were flat at 0.8%. Services inflation fell for the sixth successive month to 3.6%, from 3.9% in July 2020. Over the month, core inflation rose by 0.1%.
- Consumer inflation rose, albeit marginally, for the first time since October last year. Inflation is expected to edge higher in the months ahead, with some upward pressure coming from higher fuel prices and electricity tariffs, but there will be contained by subdued domestic demand and a stronger rand. The bulk of the upward drift will reflect the effect of last year’s extremely low base. On balance inflation is likely to remain well contained. As a result, we believe the Reserve Bank will keep interest rates unchanged at the current levels for the remainder of this year.
- The rand rallied throughout the week, continuing to benefit from risk-on sentiment.
- Manufacturing production grew for the first time in 18 months in December but ended the year 11% lower.
- Mining production reached the deepest annual contraction since 2009.
- Brent crude broke past the $60/barrel mark – levels last seen before the pandemic struck.
- The UK economy advanced by 1% q-o-q in the final quarter from 16.1% growth in the third quarter, but ended the year 9.9% weaker.
- Japan’s economy grew by a seasonally adjusted annualised 12.7% in the final quarter from 22.7% in the third quarter.

Please give us a call or email if you need any assistance. Have great weekend!
Kind regards,
Your TurnPoint Team
Vic Hodoul CFP®
Certified Financial Planner®
Cell +27 (0) 79 353 1076 Email vic@turnpoint.co.za
Office/Admin Manager: Arlene Schoeman: +27 (0)21 555 1010 Email arlene@turnpoint.co.za
TurnPoint Investments
Website: https://turnpoint.co.za
Milnerton Office: 5 Royal Atlantic, Sunset Beach 7441
Cape town Office: Suite 824, The Onyx, 57 Heerengracht Street, Foreshore 8005
Tel +27 (0)21 555 1010 Fax +27 (0)86 589 2738
Individual and Corporate Investment, Retirement, Estate, Risk and Tax Planning Solutions
TurnPoint Investments (Pty) Ltd. Registration Number 2003/020010/07 | Financial Service Provider (FSP licence number 12820) Directors VD Hodoul DL Hodoul